How to installation Prometheus & Grafana with docker compose? for using docker, you need to install docker desktop in your local computer See installation. Next successfully install docker, please create file docker compose with name docker-compose.yaml 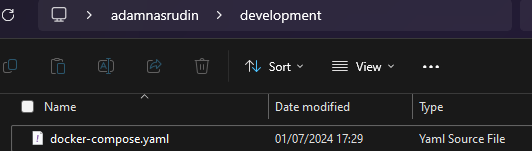
update it with following content:
version: '3.9'
services:
  grafana:
    image: grafana/grafana:latest
    container_name: grafana
    ports:
      - "3000:3000"
    volumes:
      - grafana-storage:/var/lib/grafana
  prometheus:
    image: prom/prometheus:v2.24.0
    volumes:
      - ./prometheus/:/etc/prometheus/
      - prometheus_data:/prometheus
    command:
      - '--config.file=/etc/prometheus/prometheus.yml'
      - '--storage.tsdb.path=/prometheus'
      - '--web.console.libraries=/usr/share/prometheus/console_libraries'
      - '--web.console.templates=/usr/share/prometheus/consoles'
    ports:
      - 9090:9090
    restart: always

volumes:
  grafana-storage:
  prometheus_data:
next steep setup prometheus config, for that you need to create file my-config.yml :
mkdir prometheus
touch /prometheus.yml
and update it with following content:
global:
  scrape_interval:     15s
  evaluation_interval: 15s

scrape_configs:
  - job_name: prometheus
    static_configs:
      - targets: ['localhost:9090']
  - job_name: golang
    metrics_path: /prometheus
    static_configs:
      - targets:
        - golang:9000
next steep running docker compose, please use following command:
docker-compose up -d
Check And Running Prometheus & Grafana
Open docker desktop, check container Prometheus, Grafana, and run. 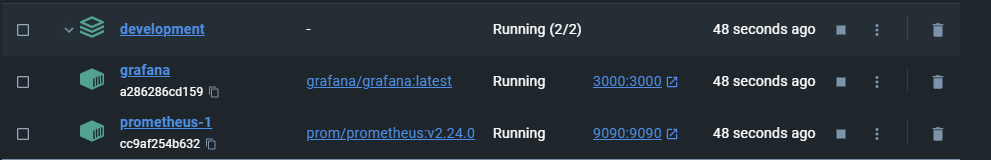 Open Prometheus in browser.
 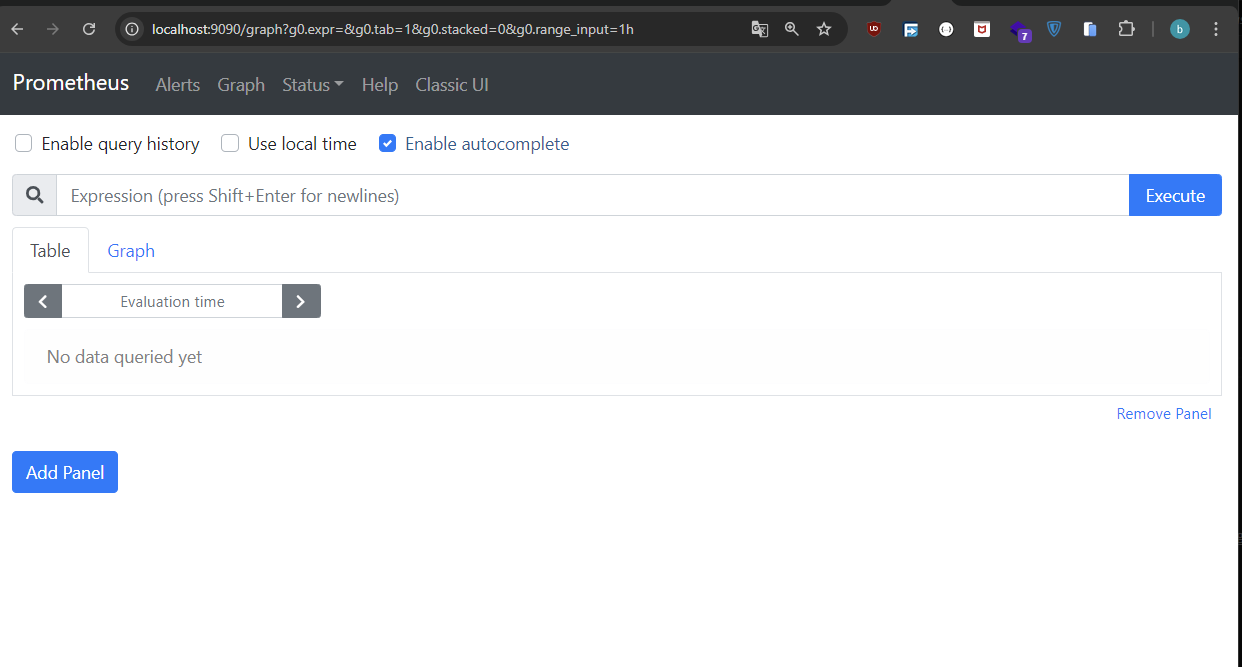 Open Grafana in browser, login with username and password default
 admin. 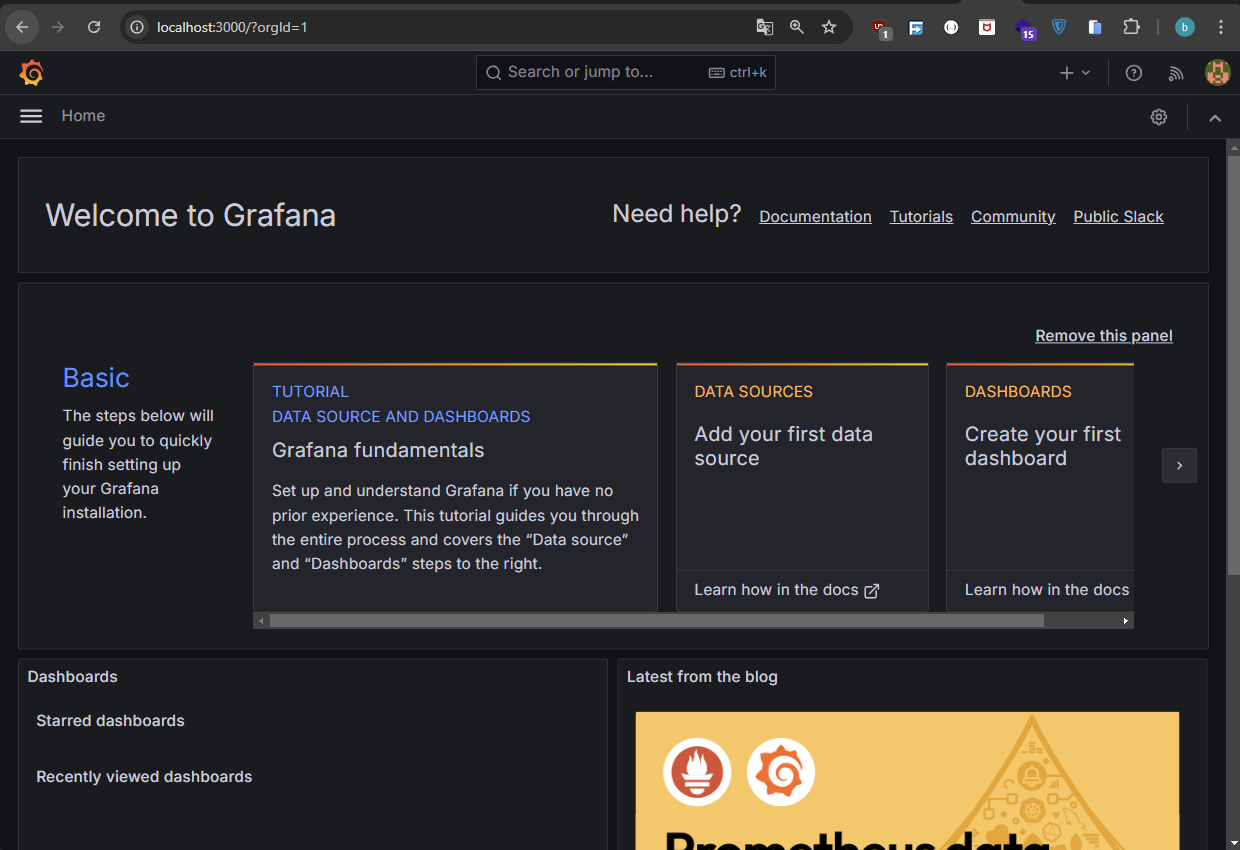
Congratulation, Prometheus & Grafana is installed and ready to use.